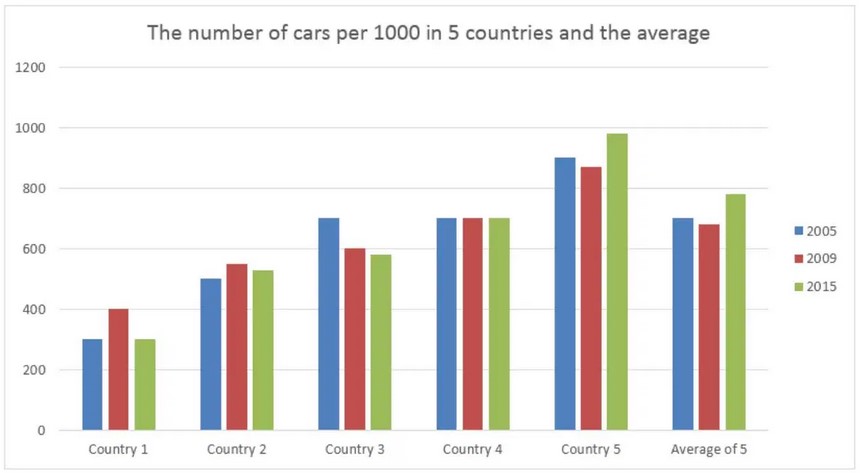
The bar chart shows the number of cars per 1000 people in 5 European countries in 3 years and compares with the European average. Summarise the information by selecting and reporting the main features and making comparisons where relevant.
Sample Answer of The Bar Chart Shows the Number of Cars per 1000 People in 5 European Countries in 3 Years
The bar chart depicts the number of cars per thousand people in five different European countries between 1960 and 2000. Overall, Car and Foots the highest leading the services of the number of the Car in the year 1960 and 2000 respectively.
To start with, Bus shows the fluctuations in the figure for the number of cars in the period of 3 years this accounted for 20, 27 and 18 respectively. In comparison, Car illustrates the remarkable increase in the numbers of Car which accounted for around 5 in 1960 then 25 in 1980 and around 35 in 2000.
Bike and Foot show a similar trend in the decreasing order over a period of 3 years in the numbers of cars per 1000 people which accounted for 27, 22 and 7 for Bike and 35,17 and 10 for Foot respectively.
Follow Us on IELTSTrend Twitter
Also read: Large Companies Should Pay Higher Salaries to CEOs and Executives


Leave a Reply