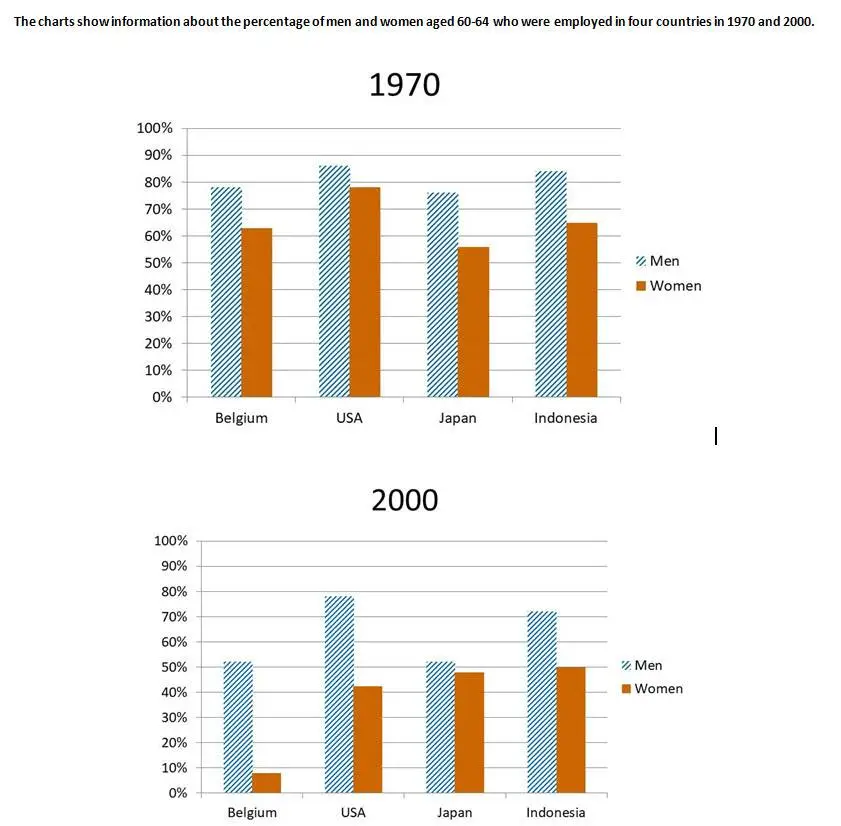
The cart show information about the percentage of men and women aged 60-64 who were employed in four countries in 1970 and 2000. Summarise the information by selecting and reporting the main features, and make comparisons where relevant.
The bar chart presents the information about the employer ratio between the men and women in between of 1970 to 2000 in four different countries.
The information is then given in the form of the percentage. The comparison is then between Belgium, the USA, Japan and Indonesia. It is crystal and clear that Belgium was leading in 1970, but in the opposite, the USA was higher in 2000. Overall all the countries have faced the downfall in work aspect.
In 1970, Belgium was leading with almost 65 % in women ratio and 78 % in men ratio, whereas in 2000, Belgium dumped to approximately 52 % in men and 10 % in women. The USA was top of the table in 1970, having a ratio of around 90% in men and 80% in women. While in the other hand in 2000, men and women ratio faced downgrade in order to 10% and 30%. Having the difference only of 20 %, Japan has a ratio of almost 80 % of men and 60 % of women.
However, in 2000, the ratio was reduced and sucked at 50 % in both. Indonesia has the almost same as used in the term of men, however in women, it was approximately as same as Belgium meanwhile in 2000, men were at 70 %, and women were at half of the total.
Follow Us on IELTSTrend Twitter


Leave a Reply