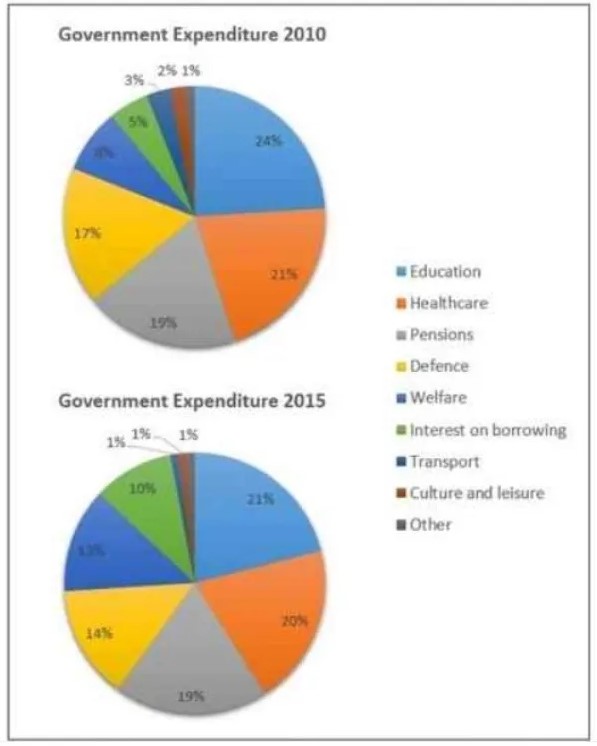
The charts below show local government expenditure in 2010 and 2015. Summarise the information by selecting and reporting the main features and making comparisons where relevant
Sample Answer of The Charts Below Show Local Government Expenditure in 2010 and 2015
The pie chart illustrates yearly expenses by local government in nine different sectors from 2010 to 2015.
Overall most of the areas, the government expenses has decreased a lot, but expenses on the internet as increased over the time period.
In the four largest areas of government expenditure, education, Healthcare, pension and defence, with education taking the largest share of 24% in 2010 and 21% in 2015, the smallest area of Expenditure were transport, culture and leisure.
The interesting lead between 2010 and 2015 spending on all four of the largest area had dropped with the exception of tension which remains the same at 19 % spending on transport and culture and diesel also fell significantly with the transport budget declining by two-third. On the other hand spending on welfare and internet on government rose mark Lee with doubling over five year period by 10%.
Follow Us on IELTSTrend Twitter
Also read: Information About the Country of Birth of People Living in Australia


Leave a Reply