The bar graph indicates sales figures for reading materials from 2002 to 2012. Write a report to a university lecturer describing the information shown below. Write at least 150 words.
Sample Answer The Bar Graph Indicates Sales Figures for Reading Materials From 2002 to 2012
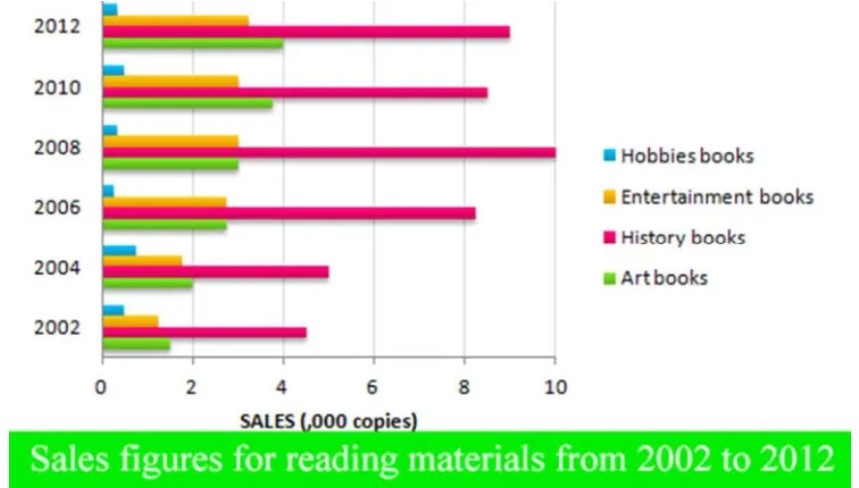
The given column graph illustrates the sale of reading material copies in thousand from 2002 to 2012.
Overall, it is clear from the graph that the copies of entertainment and art books rose between two years. However, the copies of history books rose slightly.
We can see from the graph that the number of hobby book copies increased between 2002 to 2012. Then the copies of entertainment books were climbing up slowly from 1000 copies to almost 4000 copies.
The sale of history book copies was jumping up and then full down in the year 2008. The most copies which were read by people is artbook from 2002 to 2012. The copies of art books climbed up from 1500 copies to 4000 copies from 2002 to 2012. History books had the highest number of Copies which were sold during the given time.
Follow Us on IELTSTrend Twitter
The Chart Shows Days Taken Off Work Due to Stress-Related Illnesses by Job for Men and Women